scite Is Used in Every Country Around the World
Here's who's using it and how they are using it
Tue Nov 30 2021As we start to work with universities and other institutions on providing organizational licenses, we often get questions about how many of their students, faculty and staff are already using scite. Even some of our users and partners have expressed interest in who is using scite. We can't give a full picture of this since users often do not self-identify which institutions they come from, use personal emails, or use ad blockers preventing the collection of information such as location and so on. However, we can give a partial description of our user demographics and we wanted to outline this in a post to help people understand who scite users are and where they come from. For a better understanding of how many users tend to use ad blockers see the numbers compiled by hootsuite presented here
Below is a description of who is using scite broken out by institution and location. All of these numbers are pulled from our database and analytics providers as of November 15th, 2021.
If you have any questions, or you belong to one of the institutions below and would like a more detailed look at how your institution is using scite please let us know at hi@scite.ai
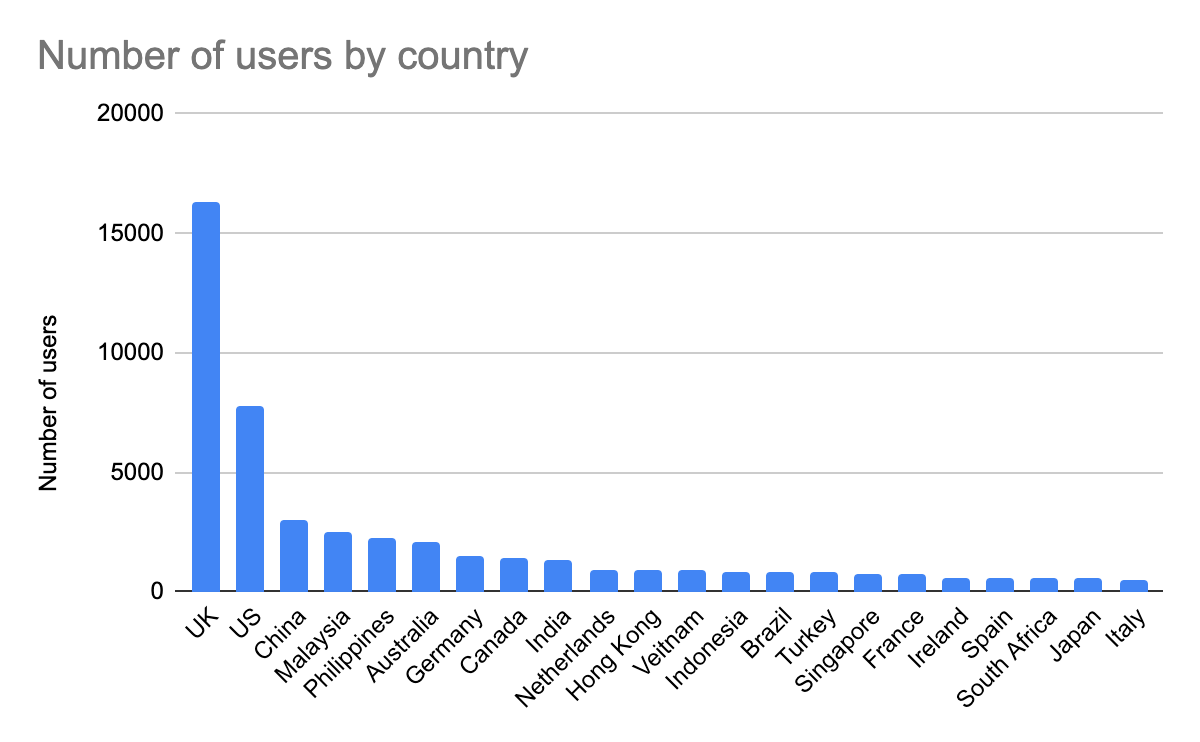
Location demographics
First, we'd like to present where users are coming from. This data only includes users with attributable location data, this means if they were using an ad blocker we wouldn't have that information available. Out of users who have some attributable location data, it is clear that the UK and US are our biggest contingent. In some ways this makes sense as we are based in the US and primarily market and communicate about scite in English. However, we continue to be surprised about how popular scite is in the UK. Next, we have a large core set of users in China, Malaysia, and the Philippines. We have many loyal users who have given us great feedback particularly from Malaysia and we continue to try to meet their research needs. One piece of very valuable feedback we have received from this region is price sensitivity. We are constantly working on our pricing and trying to make sure it is affordable, especially for students. Our primary strategy for making scite more affordable for students has been working with universities to provide a license for all the students and researchers at that university.
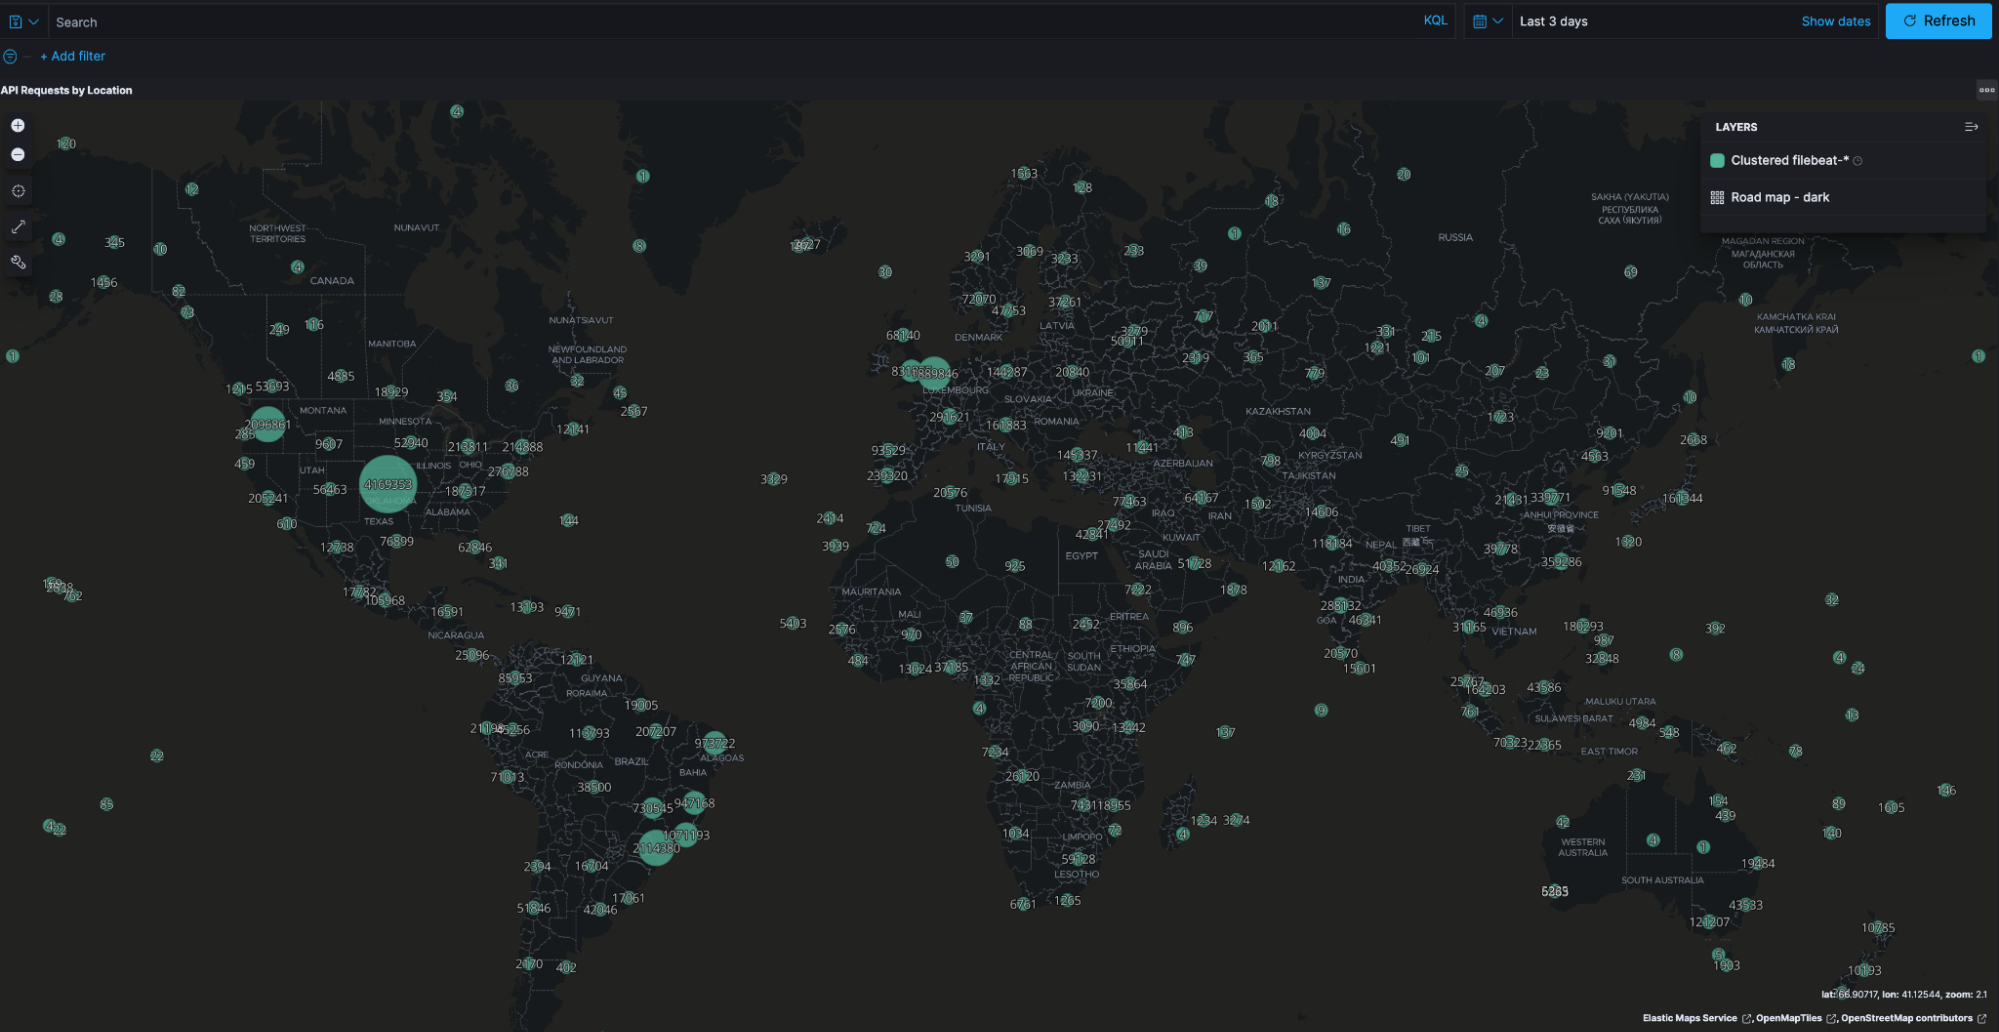
We can also show API requests by location for the past 3 days to give you a better idea of how usage is distributed globally.
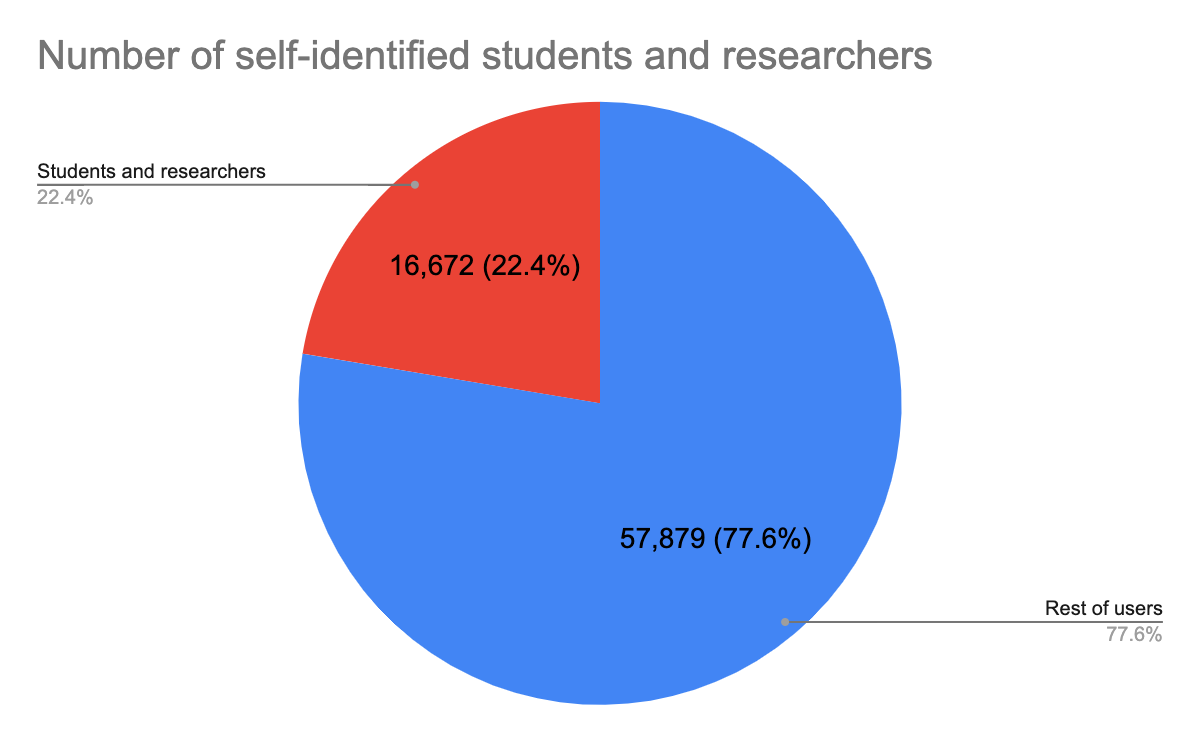
Number of self-identified students and researchers
To give you a picture of how many students and researchers are represented in the usage analyses below, we present the number of self-identified students and researchers out of all of our users. Students and researchers are self-identified if they have used an institutional email or put an affiliation to an academic institution in their profile.
It is important to note that as a research tool, scite naturally caters primarily to students and researchers. Therefore the figure of 22.4% is likely to vastly underestimate the number of students and researchers actually using scite.
Institutional usage of scite
Below is a picture of how scite is used broken down into academic institutions according to the number of users, report views, and searches made. Some notes of interest are that the institutions appear to break down according to the location demographics presented above with the exception of US institutions which don't appear as much. This could be that US users employ ad blockers more frequently than their UK counterparts or use personal email addresses more frequently.
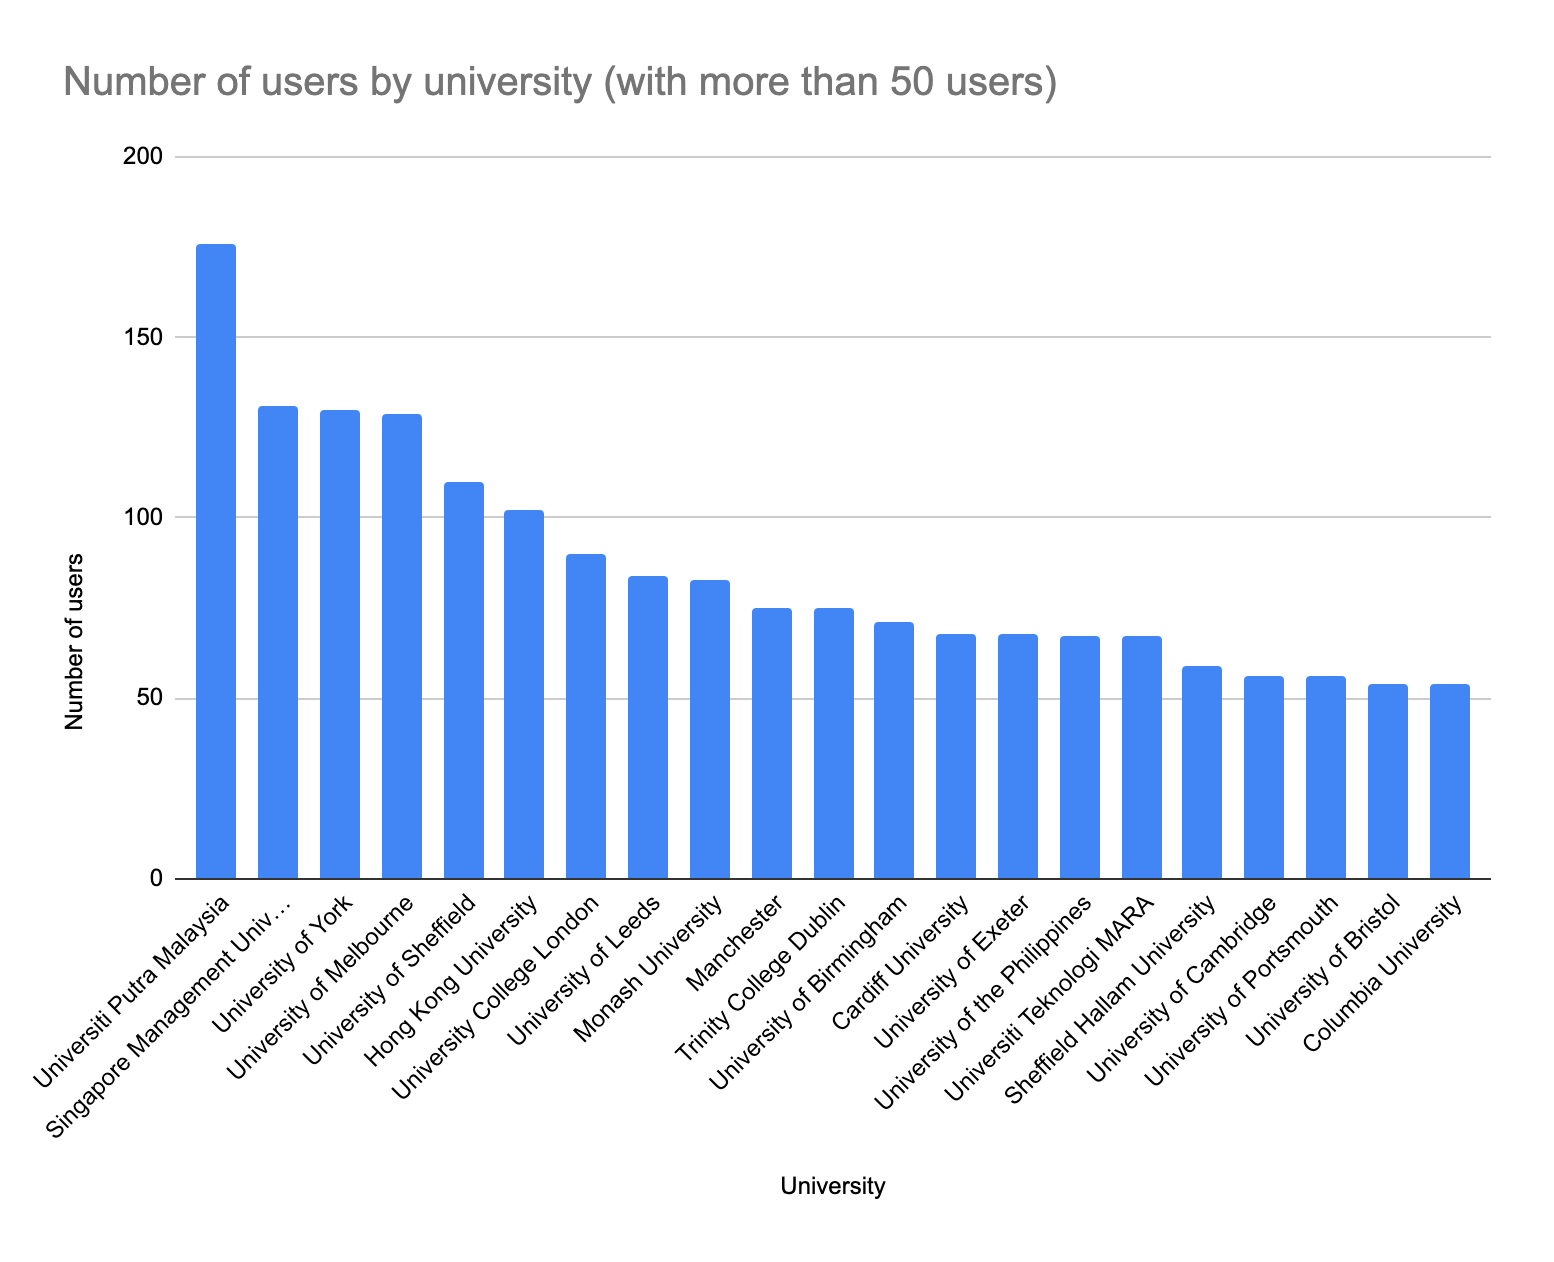
Institutional users
The number of users by university is presented below for universities that have more than 50 users. We have close to 250 universities that have at least 10 or more users, but presenting those would be too much for a chart.
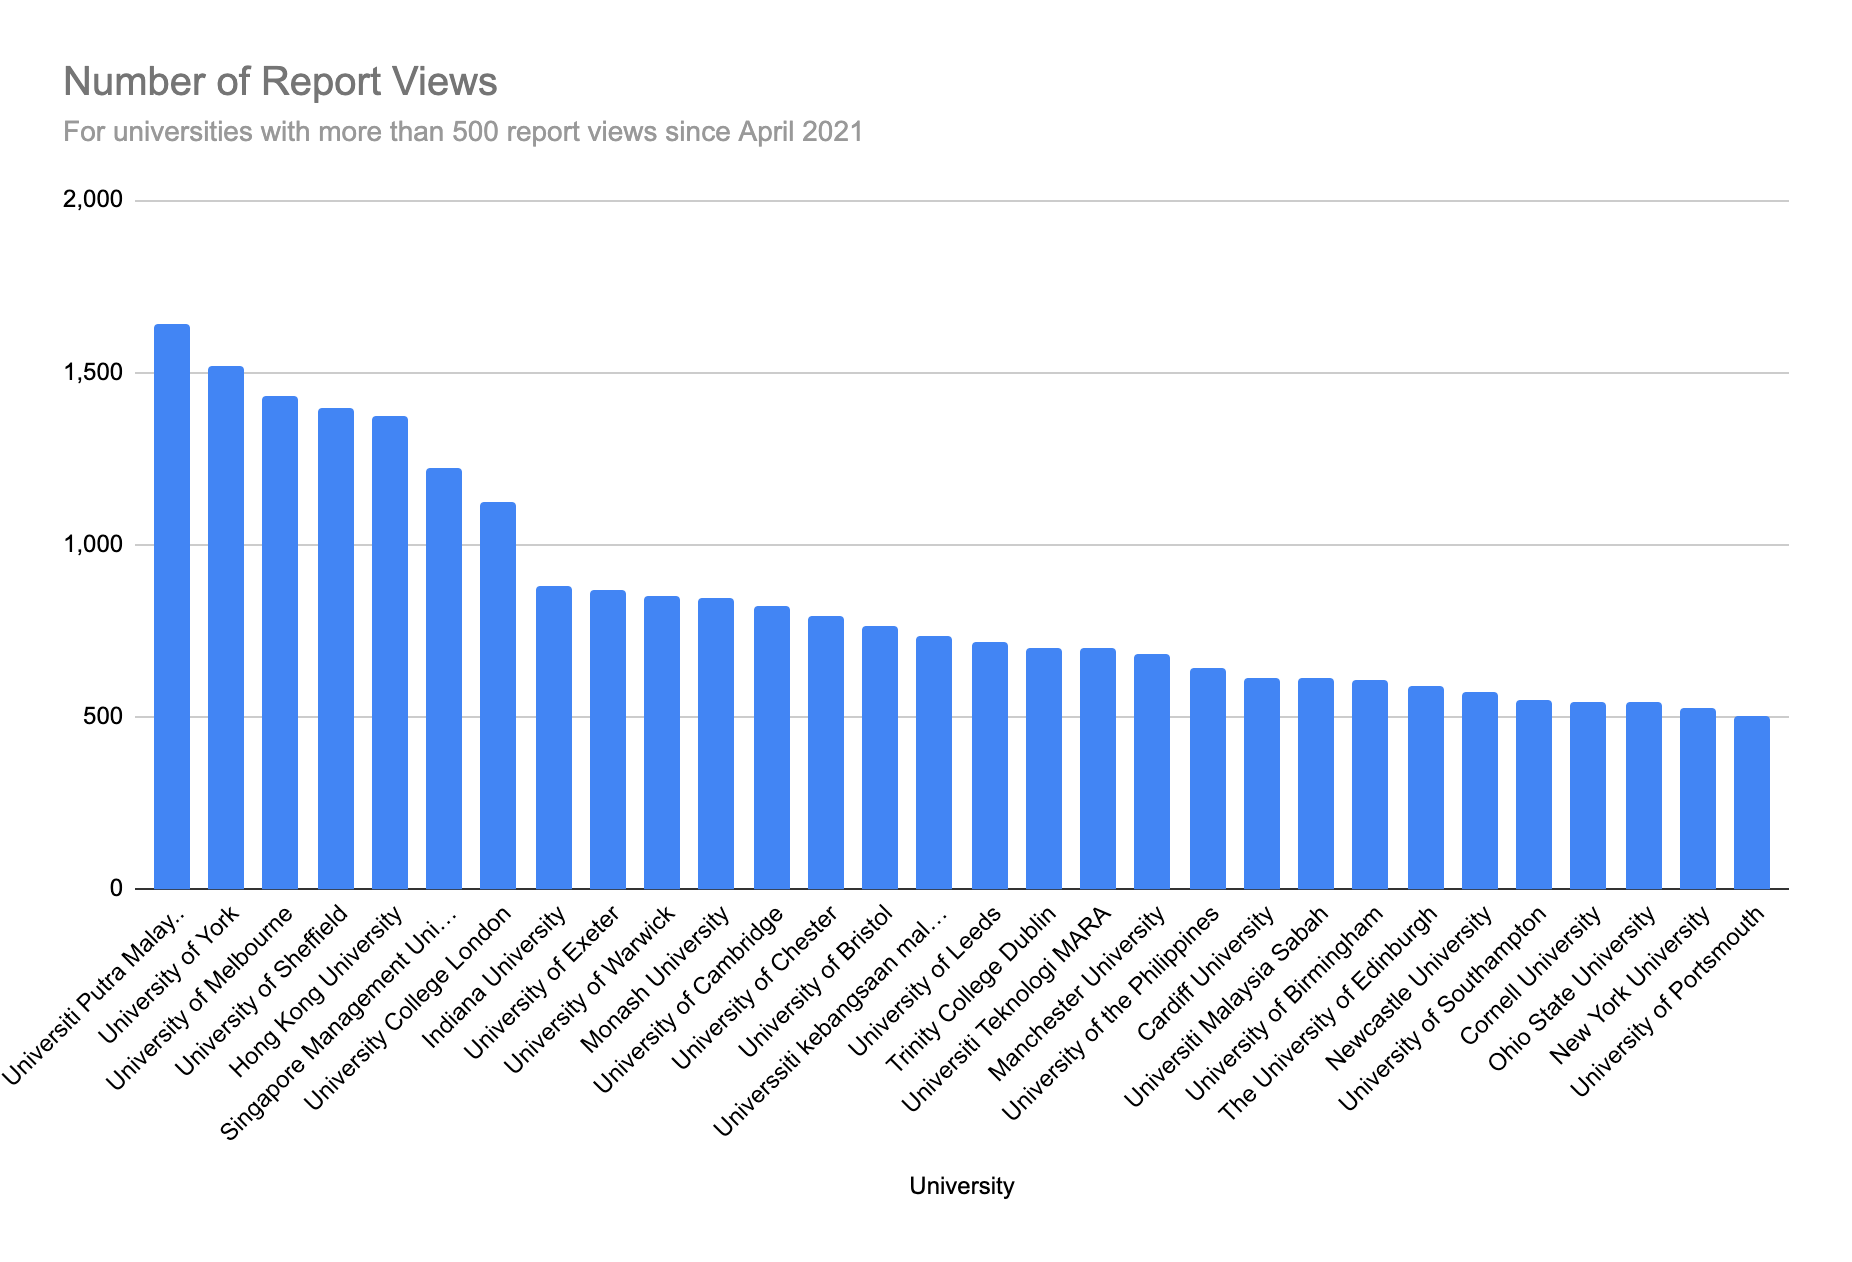
Institutional report views
Reports are the fundamental feature of scite, where users can read everything that has been said about a particular publication. Because of this our primary usage metrics for scite has been report views. The figure presents universities with more than 500 report views since April 2021. For context, the average number of report views per user in scite is 6.9 reports per month.
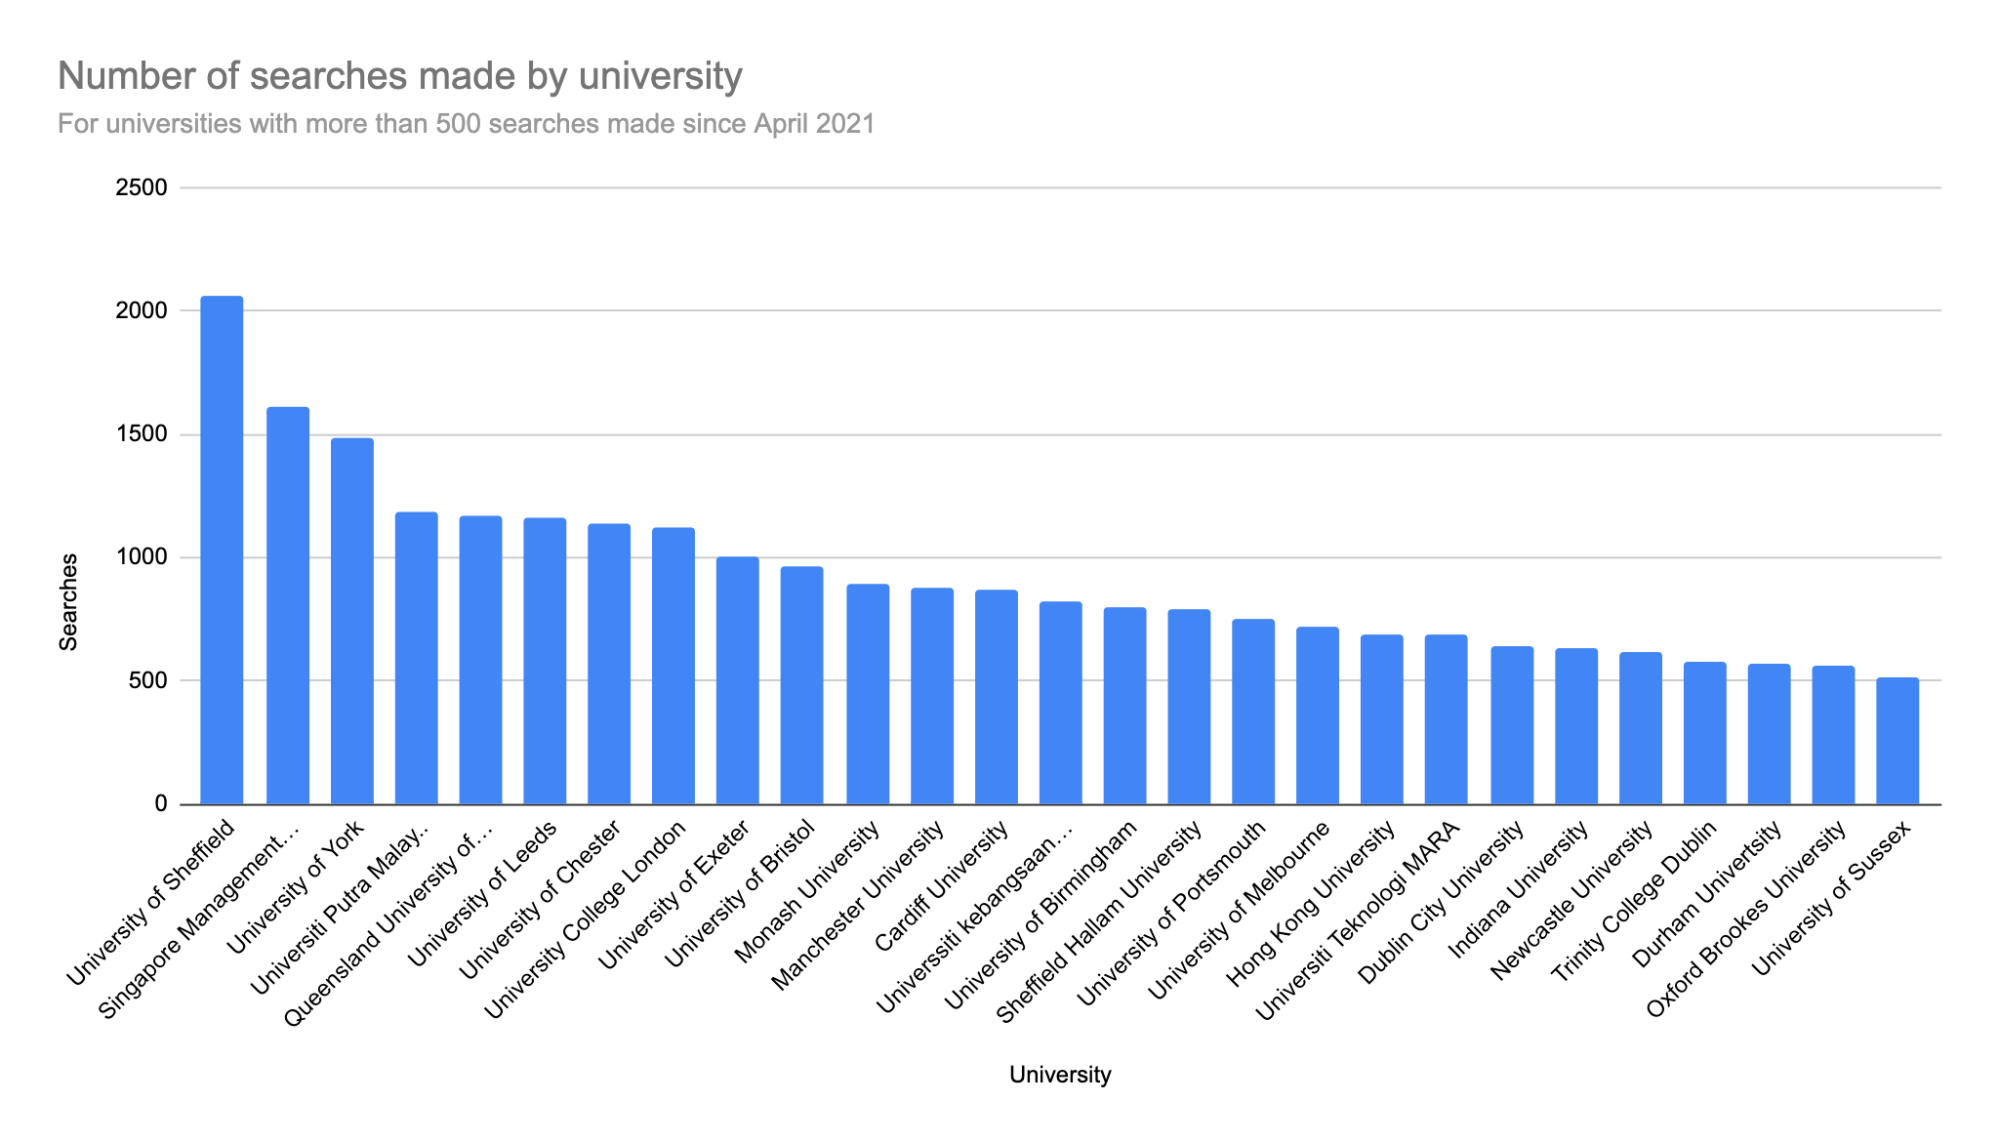
Institutional searches made
While scite reports are important for understanding and evaluating literature, it is important not to understate the importance of scite search for discovering well supported publications, publications to cite, and general facts and figures. The numbers below present the number of searches made per academic institution since April 2021 where the number of searches made is greater than 500 searches. Again for context, the average number of searches made per user per month is 8.8 searches.
Discussion
When looking at the primary usage metrics of scite by institution it becomes apparent that there are clearly dedicated groups within each of the institutions above that are using scite actively to help with their research. As indicated by the percentage of self-identified students and researchers, there are probably a lot more institutions and users belonging to the institutions presented above that are represented in the charts.
If your institution is represented on the charts above and you don't have a scite license, we'd love to talk. Feel free to contact us at hi@scite.ai We provide free no obligation trials so that your entire organization can try scite. Feel free to get started by filling in this form!
You can also contact us If you are just curious about our user demographics or usage data in general we'd love to hear from you.
scite is a Brooklyn-based organization that helps researchers better discover and understand research articles through Smart Citations–citations that display the context of the citation and describe whether the article provides supporting or contrasting evidence. scite is used by students and researchers from around the world and is funded in part by the National Science Foundation and the National Institute on Drug Abuse of the National Institutes of Health.
Copyright © 2024 scite LLC. All rights reserved.
Made with 💙 for researchers